With this feature you can quickly analyze and understand everything there is to know about any property or region.
Analytics Layers
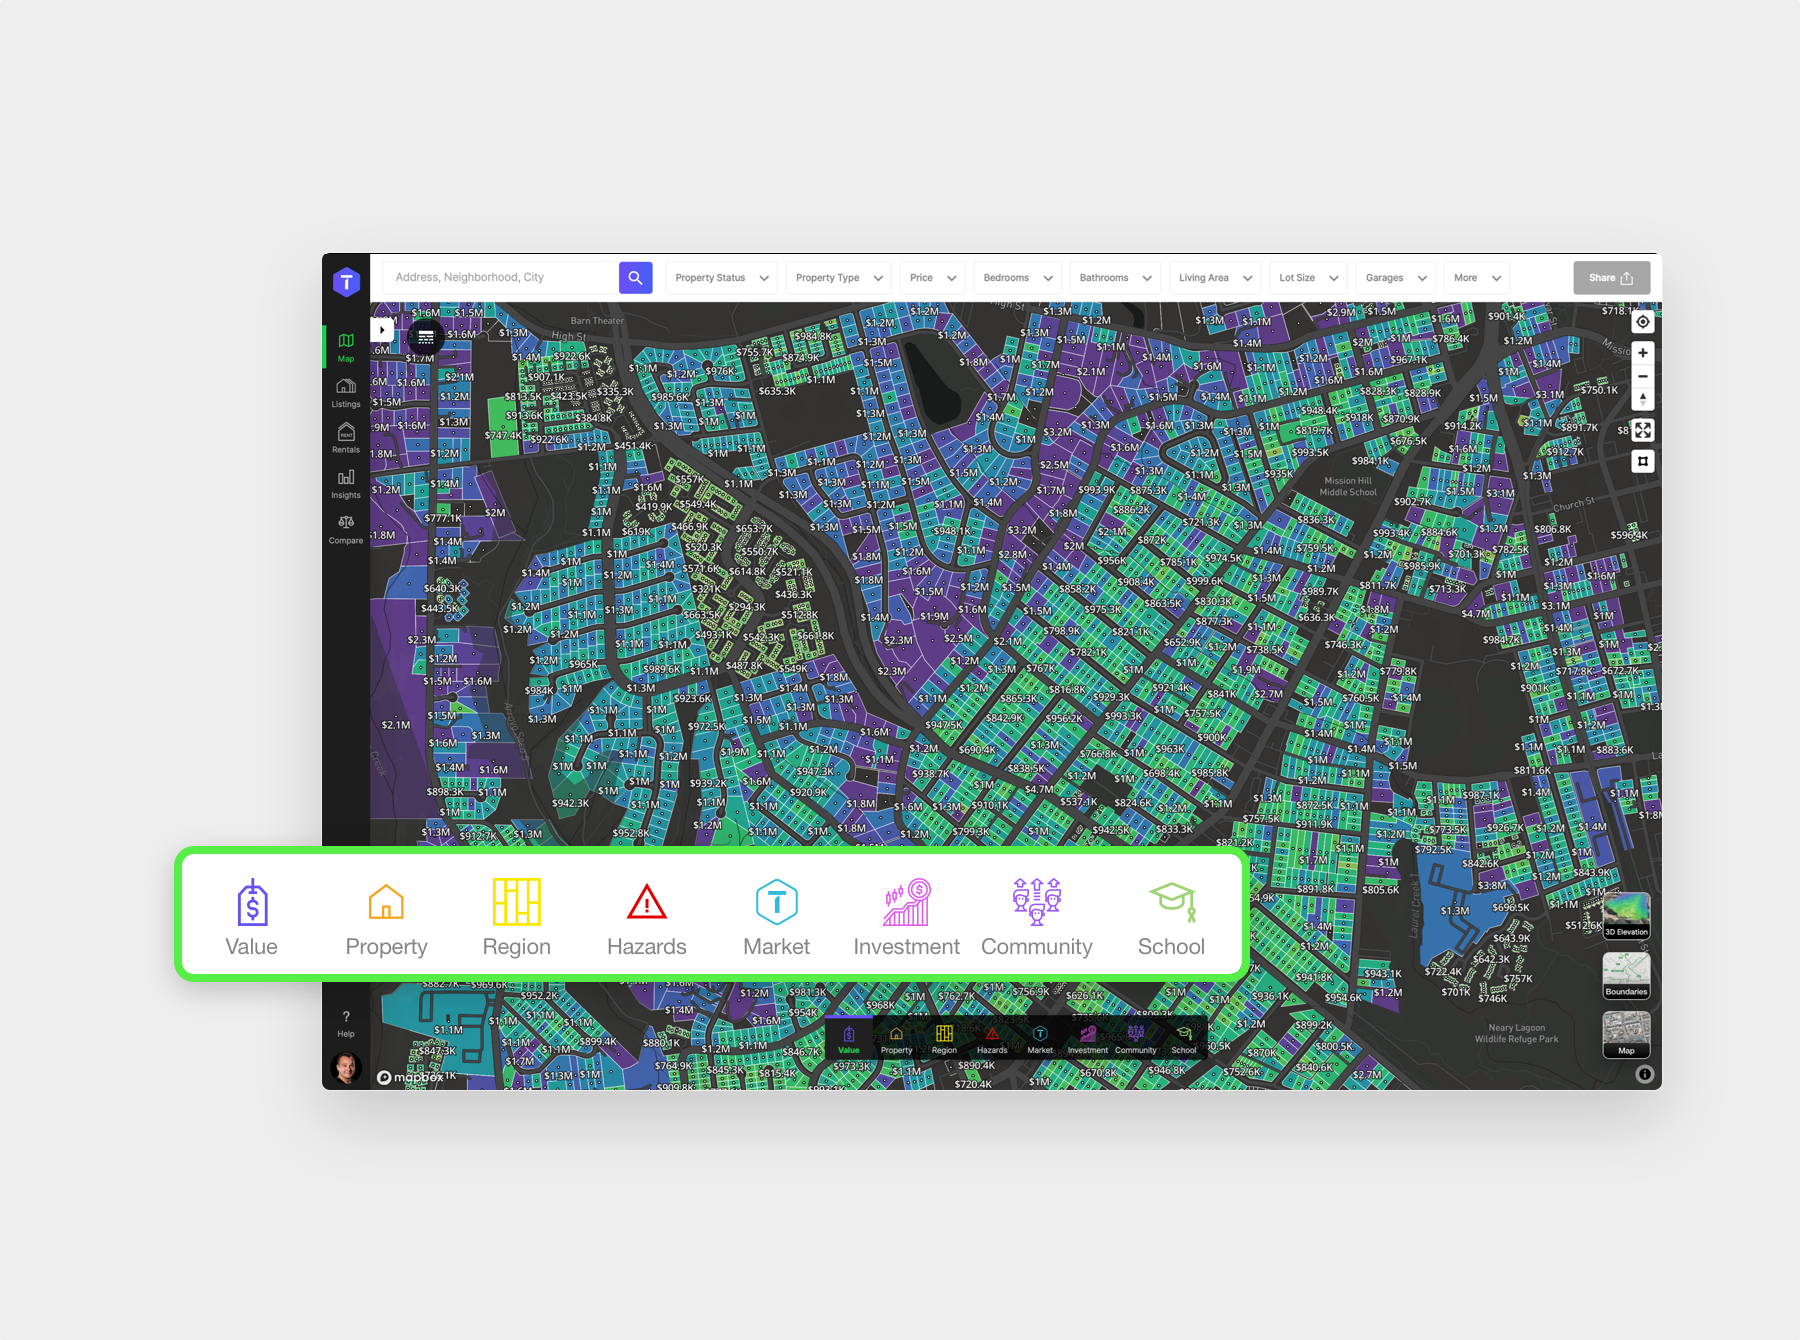
By hovering over a category you see the map analytics layers that you can toggle on or off. If you hover over the layer itself, then you will see a tooltip description of its purpose. Note that some categories contain a long list of layers and you can scroll them to see more.
The layers are grouped together into the following categories to help you understand:
- What things cost with our Value Analytics
- Property details with our Property Analytics
- Area characteristics using our Region Analytics
- Hazard Analytics show you just that, Hazards.
- Our Market Analytics layers shows you market insights
- Analyze different investor favored indicators with our Our Investment Analytics
- With our Community Analytics you can learn everything about the most important aspect of any region, the people that live there.
- And with our School Analytics, you don’t just see school ratings and attendance zones but so much more.
Selecting a layer
If you Click a layer then you will notice that the map will load it and the Legend will change to show you the currently selected layer details and its current minimum and maximum value range. Note the legend has the same layer Tooltip that you can recall by hovering over the info icon. If you click on a selected layer again then it will be hidden. To close the layer bar menus either move your mouse away or click anywhere outside of it.
As you explore the different layers to get a deep understanding of properties and regions you’ll notice that some layers have additional options that show up in the legend when the layer is enabled.


