
When I looked at TopHap last fall, I saw enormous potential in the browser app, which powerfully illustrates the deep data that really powers the real estate industry.
Recently, I managed to get a look at a new version of this powerful software, set to go live next week, and what I saw is impressive.
Proximity to schools and a nice park nearby are merely surface-level data points — the easiest-to-understand value indicators. But houses get more expensive when construction restrictions, such slope lot, earthquake zones, and other environmental concerns enter the picture.
Then in a more exploratory soft beta, the company has taken months to build out a much more market-ready interface. What I saw was a very sharp tool for techy property data geeks who help developers, investors and buyers who like to dig into the meta-market.
Now, TopHap is one of the most compelling, everyday business-decision tools I’ve seen this year.
The property search experience is far superior than Zillow, realtor.com and Homesnap.
It can help agents and brokerages market by tracking where values are heading, buyers know how to offer to put themselves in the best competitive position, and sellers understand pricing.
With a virtually unmatched interface that colorfully processes critical comparative market analysis (CMA) information into visible, actionable insights, the only thing holding this software back right now from its inevitable acquisition is that it’s currently only available in California.
Active, sold and pending listings can be searched and compared with intricate, multilayer charts, perfect for listing presentations and buyer consultations. This is found in the new infinitely customizable CMA+ module.
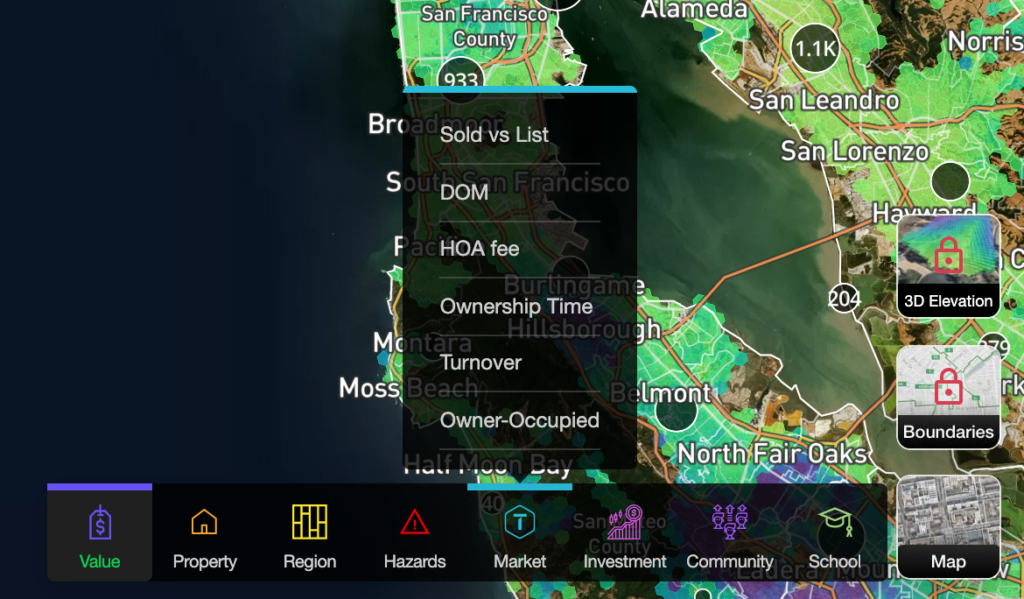
New to the app is a prominent control panel that provides access to a rich suite of data filters, which splashes results across a graduated heat map.

The software can make users smarter about how land use, government policies, geographic boundaries, municipal infrastructure, airports, bodies of water, fault lines and traffic counts weave an intricate web of data points to support why houses, strip malls and office buildings are built where they’re built. It’s not random, and neither are home values.
TopHap breaks it all down according to: value, property, region, hazards, market, investment, community and school.
Each category has a lengthy list of searchable data points, ranging from appreciation trends (value) to seasonal population (community) to temperature averages (region). There’s nothing you can’t learn from it, including a region’s N2O (nitrous oxide) index and volume of particulate matter.
You can filter according to common MLS-type data, such as homes with garages and pools and bathroom counts. But where’s the fun in that?
The TopHap team was able to use its road and aviation noise filter to demonstrate value trends according to proximity to the San Francisco airport. Yes, noise issues are a known concern, but now you can show a buyer what it’s like on specific streets. And that’s what TopHap is all about: deep, beyond-hyperlocal real estate data.
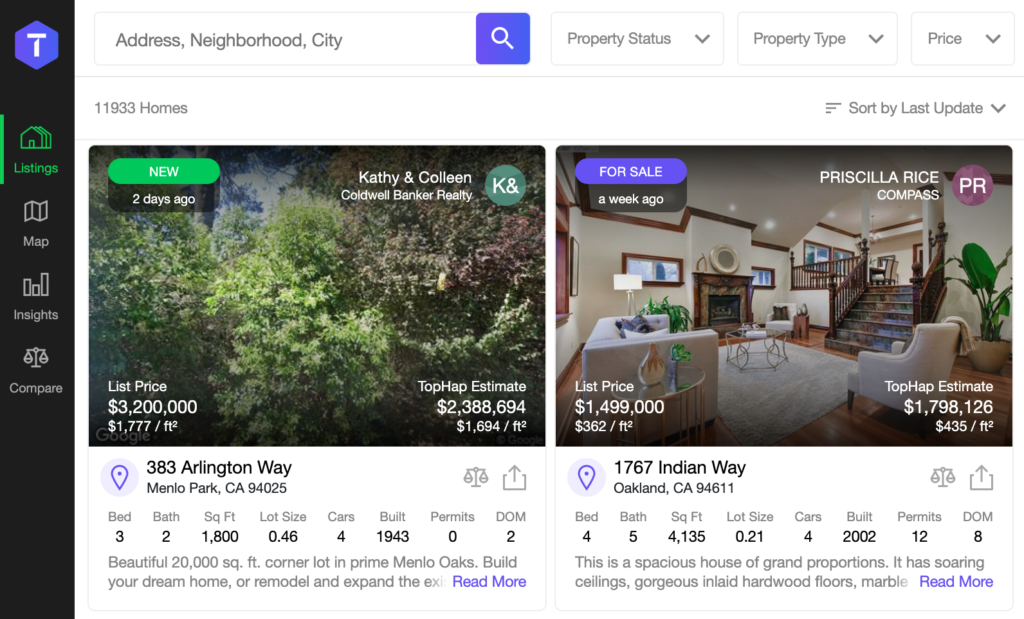
The new version has a new left-hand navigation menu offering quick access to listings, map search, insights and the property comparison features.
The property search experience is far superior than Zillow, realtor.com and Homesnap. It cleanly overlays property details such as agent and brokerage, price per square foot, days on market, and even the number permits the property has been associated with since construction, indicating right away to shoppers that it might have undergone a number of renovations or repairs.
I can’t attest to how quickly TopHap can propagate its model on a national level, but we should all hope it will be quickly.
You can also scroll pictures within the image box, which isn’t unique to TopHap, but proof it knows what web users prefer.
In regard to its ability to accurately offer property valuations, TopHap claims its AVM has 2.5 percent margin of error. In a search of my market, I found that number to be a bit off. However, I also live in an area where solds take years to make it into public databases.
Additionally, TopHap smartly includes a 1-5 “confidence” scale on its valuations, a way to openly admit, “Hey, this one is likely not on target.”
If Zestimates have taught us anything though, it’s that value is in the underlying data and the agent’s ability to interpret it.
The confidence meter is included in each property detail page, whether on or off the market, in addition to TopHap’s other charts, data points, and dynamic bar graphs for comparing the subject home to nearby properties.
I can’t attest to how quickly TopHap can propagate its model on a national level, but we should all hope it will be quickly. For now, California agents should consider registering.
There’s little doubt TopHap will find its way on to the partner lists of multiple listing services and other industry marketplaces.
Well done.


