176 Rogue Ct
Fairfield, CA 94534
- 2Beds
- 3Baths
- 1,240ft²Living Area
- 1,153ft²Lot Size
- -Pool
- 2Car
- 2001Year Built
- -DOM
- -Permit
Property Valuations
Latest estimates for 176 Rogue Ct based on TopHap automated valuation model (AVM).
TopHap Estimate
$451,200
$363/ft²
+$252K above Sold Price
Updated 3 months ago
Last Sold Price
$199,000
$160/ft²
15 years ago
176 Rogue Ct is valued at $451,200 by TopHap AVM 3 months ago.
176 Rogue Ct was last sold in 2008 for $199,000.
Current Ownership
Information about the current owner(s).
Taxes Billed
Taxes billed in 2022$2,847.04From latest Total Assessed Value1.13%Total Assessed Value$251,230=Land+
Assessed Value$100,996Additions
Assessed Value$150,234
In 2022, taxes billed for 176 Rogue Ct were $2,847.04, which is 1.13% from latest Total Assessed Value of $251,230.
Property History
176 Rogue Ct has undefined property events records (listings, deeds, permits, tax, foreclosure, loan).
Environment
Environmental factors around 176 Rogue Ct
Hazard Risks
Earthquake489Nat'l Avg100Particulates95Carb Mono90Ozone87Air Pollution83Lead38Hail2Tornado1Hurricane0Weather0Wind0
9 hazards (Carbon Monoxide, Earthquake Risk, Hail Index, Tornado Index, Air Pollution Index, Ozone Index, Lead Index, Particulate Matter, National Average) are above the national average around 176 Rogue Ct.
Walkability Index
12 /20
Most Walkable
20-18
Very Walkable
17-15
Somewhat Walkable
14-10
Car Dependent
9-0
176 Rogue Ct has a walkability score of 12 out of 20, which means that it is in a somewhat walkable area.
Noise Level
50 dB
Quiet Suburban Residential 0-49
Suburban Residential 50-54
Urban Residential 55-59
Noisy Urban Residential 60-64
Very Noisy Urban Residential 65+
Noise at 176 Rogue Ct is around 50dBs, which is comparable to a Suburban Residential area.
Temperature
Seasonal temperature sampled over multiple years
Winter
Average
Low
39°F
High
57°F
Summer
Average
Low
55°F
High
87°F
In the winter at 176 Rogue Ct, temperatures range from 39.22°F to 56.95°F with an average of 48.09°F. In the summer, the temperature ranges from 55.25°F to 86.86°F with and average of 71.06°F.
School Information
Public/private schools serving 176 Rogue Ct
Public Schools
Nearby public schools serving 176 Rogue Ct have ratings undefined, undefined, undefined, and undefined.
Neighborhood
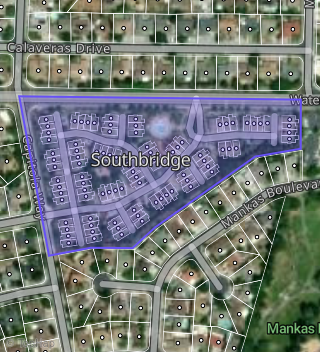
This property is located in Southbridge, Fairfield, CA 94534.
Seasonal Housing units 94534
17%of housing is for seasonal rent.
Daytime Population for 94534
-5%of people during work hours.
Boundary map of Southbridge.
Crime Index for 94534
58
The crime index in 94534 is 58, which is 0.6 times lower than national average.
Market Trends
Historical market data near 176 Rogue Ct over selected time period.
Nearby Properties on Rogue Ct
- 177 Rogue Ct, Fairfield, CA 94534 (Southbridge) is a 1,416 square foot, 3 bedroom, 3.25 bathroom, 0.03 acre property. It was built in 2001 and has an estimate of $513,484 with a price per ft² of $363.
- 175 Rogue Ct, Fairfield, CA 94534 (Southbridge) is a 1,240 square foot, 2 bedroom, 3.25 bathroom, 0.03 acre property. It was built in 2002 and has an estimate of $443,769 with a price per ft² of $358.
- 176 Rogue Ct, Fairfield, CA 94534 (Southbridge) is a 1,240 square foot, 2 bedroom, 3.25 bathroom, 0.03 acre property. It was built in 2001 and has an estimate of $463,004 with a price per ft² of $373.
- 170 Rogue Ct, Fairfield, CA 94534 (Southbridge) is a 1,416 square foot, 3 bedroom, 3.25 bathroom, 0.03 acre property. It was built in 2002 and has an estimate of $522,306 with a price per ft² of $369.
- 171 Rogue Ct, Fairfield, CA 94534 (Southbridge) is a 1,240 square foot, 2 bedroom, 3.25 bathroom, 0.03 acre property. It was built in 2001 and has an estimate of $467,077 with a price per ft² of $377.
- 172 Rogue Ct, Fairfield, CA 94534 (Southbridge) is a 1,240 square foot, 2 bedroom, 3.25 bathroom, 0.03 acre property. It was built in 2001 and has an estimate of $457,894 with a price per ft² of $369.
- 173 Rogue Ct, Fairfield, CA 94534 (Southbridge) is a 1,416 square foot, 3 bedroom, 3.25 bathroom, 0.03 acre property. It was built in 2002 and has an estimate of $514,067 with a price per ft² of $363.
- 174 Rogue Ct, Fairfield, CA 94534 (Southbridge) is a 1,416 square foot, 3 bedroom, 3.25 bathroom, 0.03 acre property. It was built in 2002 and has an estimate of $520,050 with a price per ft² of $367.