300 Leland Ct
Lodi, CA 95242
- 3Beds
- 3Baths
- 2,175ft²Living Area
- 0.3acLot Size
- -Pool
- 2Car
- 1988Year Built
- -DOM
- -Permit
Property Valuations
Latest estimates for 300 Leland Ct based on TopHap automated valuation model (AVM).
TopHap Estimate
$690,250
$317/ft²
+$151K above Sold Price
Updated 3 months ago
Last Sold Price
$539,000
$248/ft²
3 years ago
300 Leland Ct is valued at $690,250 by TopHap AVM 3 months ago.
300 Leland Ct was last sold in 2021 for $539,000.
Current Ownership
Information about the current owner(s).
Taxes Billed
Taxes billed in 2023$6,002.14From latest Total Assessed Value1.07%Total Assessed Value$560,775=Land+
Assessed Value$93,636Additions
Assessed Value$467,139
In 2023, taxes billed for 300 Leland Ct were $6,002.14, which is 1.07% from latest Total Assessed Value of $560,775.
Property History
300 Leland Ct has undefined property events records (listings, deeds, permits, tax, foreclosure, loan).
Environment
Environmental factors around 300 Leland Ct
Hazard Risks
Earthquake126Particulates102Nat'l Avg100Ozone85Air Pollution83Carb Mono79Lead40Tornado28Weather8Hail0Hurricane0Wind0
9 hazards (Carbon Monoxide, Earthquake Risk, Tornado Index, Air Pollution Index, Ozone Index, Weather Risk, Lead Index, Particulate Matter, National Average) are above the national average around 300 Leland Ct.
Walkability Index
7 /20
Most Walkable
20-18
Very Walkable
17-15
Somewhat Walkable
14-10
Car Dependent
9-0
300 Leland Ct has a walkability score of 7 out of 20, which means that it is in a car dependent area.
Noise Level
50 dB
Quiet Suburban Residential 0-49
Suburban Residential 50-54
Urban Residential 55-59
Noisy Urban Residential 60-64
Very Noisy Urban Residential 65+
Noise at 300 Leland Ct is around 50dBs, which is comparable to a Suburban Residential area.
Temperature
Seasonal temperature sampled over multiple years
Winter
Average
Low
38°F
High
57°F
Summer
Average
Low
56°F
High
90°F
In the winter at 300 Leland Ct, temperatures range from 38.18°F to 56.55°F with an average of 47.37°F. In the summer, the temperature ranges from 56.36°F to 89.67°F with and average of 73.02°F.
School Information
Public/private schools serving 300 Leland Ct
Public Schools
Nearby public schools serving 300 Leland Ct have ratings undefined, undefined, and undefined.
Neighborhood
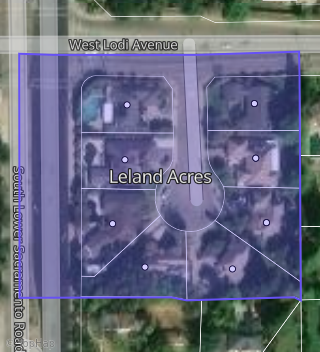
This property is located in Leland Acres, Lodi, CA 95242.
Seasonal Housing units 95242
24%of housing is for seasonal rent.
Daytime Population for 95242
-6%of people during work hours.
Boundary map of Leland Acres.
Crime Index for 95242
87
The crime index in 95242 is 87, which is 0.9 times lower than national average.
Market Trends
Historical market data near 300 Leland Ct over selected time period.
Nearby Properties on Leland Ct
- 325 Leland Ct, Lodi, CA 95242 (Leland Acres) is a 3,523 square foot, 4 bedroom, 3 bathroom, 0.25 acre property. It was built in 1990 and has an estimate of $1,010,278 with a price per ft² of $287.
- 301 Leland Ct, Lodi, CA 95242 (Leland Acres) is a 2,517 square foot, 4 bedroom, 2 bathroom, 0.24 acre property. It was built in 1989 and has an estimate of $668,556 with a price per ft² of $266.
- 309 Leland Ct, Lodi, CA 95242 (Leland Acres) is a 2,611 square foot, 3 bedroom, 2 bathroom, 0.24 acre property. It was built in 1987 and has an estimate of $722,132 with a price per ft² of $277.
- 317 Leland Ct, Lodi, CA 95242 (Leland Acres) is a 2,840 square foot, 4 bedroom, 2 bathroom, 0.23 acre property. It was built in 1988 and has an estimate of $735,554 with a price per ft² of $259.
- 300 Leland Ct, Lodi, CA 95242 (Leland Acres) is a 2,175 square foot, 3 bedroom, 3.25 bathroom, 0.25 acre property. It was built in 1988 and has an estimate of $669,640 with a price per ft² of $308.
- 308 Leland Ct, Lodi, CA 95242 (Leland Acres) is a 1,991 square foot, 3 bedroom, 2 bathroom, 0.24 acre property. It was built in 1987 and has an estimate of $650,050 with a price per ft² of $326.
- 316 Leland Ct, Lodi, CA 95242 (Leland Acres) is a 2,486 square foot, 3 bedroom, 3.25 bathroom, 0.24 acre property. It was built in 1989 and has an estimate of $691,559 with a price per ft² of $278.
- 324 Leland Ct, Lodi, CA 95242 (Leland Acres) is a 2,969 square foot, 5 bedroom, 3 bathroom, 0.28 acre property. It was built in 1989 and has an estimate of $875,203 with a price per ft² of $295.