35 Lillian Ct
San Francisco, CA 94124
- -Bed
- 38Baths
- -Living Area
- 1.3acLot Size
- -Pool
- -Car
- 1978Year Built
- -DOM
- 65Permits
Permits
35 Lillian Ct has 65 permit records of total value of $785,134.
Current Ownership
Information about the current owner(s).
Taxes Billed
Taxes billed in 2023$1,608.44From latest Total Assessed Value0.01%Total Assessed Value$22,119,526=Land+
Assessed Value$15,483,669Additions
Assessed Value$6,635,857
In 2023, taxes billed for 35 Lillian Ct were $1,608.44, which is 0.01% from latest Total Assessed Value of $22,119,526.
Property History
35 Lillian Ct has undefined property events records (listings, deeds, permits, tax, foreclosure, loan).
Environment
Environmental factors around 35 Lillian Ct
Hazard Risks
Earthquake423Particulates106Nat'l Avg100Carb Mono98Ozone90Air Pollution83Lead45Tornado7Weather3Hail0Hurricane0Wind0
9 hazards (Carbon Monoxide, Earthquake Risk, Tornado Index, Air Pollution Index, Ozone Index, Weather Risk, Lead Index, Particulate Matter, National Average) are above the national average around 35 Lillian Ct.
Walkability Index
16 /20
Most Walkable
20-18
Very Walkable
17-15
Somewhat Walkable
14-10
Car Dependent
9-0
35 Lillian Ct has a walkability score of 16 out of 20, which means that it is in a very walkable area.
Noise Level
51 dB
Quiet Suburban Residential 0-49
Suburban Residential 50-54
Urban Residential 55-59
Noisy Urban Residential 60-64
Very Noisy Urban Residential 65+
Noise at 35 Lillian Ct is around 51dBs, which is comparable to a Suburban Residential area.
Temperature
Seasonal temperature sampled over multiple years
Winter
Average
Low
44°F
High
58°F
Summer
Average
Low
54°F
High
71°F
In the winter at 35 Lillian Ct, temperatures range from 44.22°F to 58.19°F with an average of 51.21°F. In the summer, the temperature ranges from 54.13°F to 70.7°F with and average of 62.42°F.
School Information
Public/private schools serving 35 Lillian Ct
Public Schools
Nearby public schools serving 35 Lillian Ct have ratings undefined, undefined, undefined, undefined, undefined, undefined, undefined, undefined, undefined, undefined, undefined, undefined, undefined, undefined, undefined, undefined, and undefined.
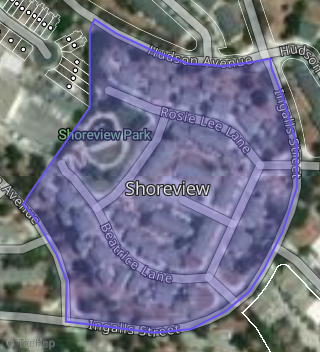
Neighborhood
This property is located in Bayview, San Francisco, CA 94124.
Seasonal Housing units 94124
6%of housing is for seasonal rent.
Daytime Population for 94124
+33%of people during work hours.
Boundary map of Bayview.
Crime Index for 94124
104
The crime index in 94124 is 104, which is 1.0 times higher than national average.
Market Trends
Historical market data near 35 Lillian Ct over selected time period.
Nearby Properties on Lillian Ct
- 35 Lillian Ct, San Francisco, CA 94124 (Shoreview) is a 44 bathroom and 1.4 acre property. It was built in 1978 and has an estimate of $1,293,385.
- 35 Lillian Ct, San Francisco, CA 94124 (Shoreview) is a 38 bathroom and 1.26 acre property. It was built in 1978 and has an estimate of $1,307,298.
- 35 Lillian Ct, San Francisco, CA 94124 (Shoreview) is a 58 bathroom and 1.83 acre property. It was built in 1978 and has an estimate of $1,295,226.
- 35 Lillian Ct, San Francisco, CA 94124 (Shoreview) is a 16 bathroom and 0.54 acre property. It was built in 1978 and has an estimate of $1,400,538.
- 35 Lillian Ct, San Francisco, CA 94124 (La Salle Apartments) is a 33 bathroom and 0.93 acre property. It was built in 1978 and has an estimate of $1,363,869.
- 35 Lillian Ct, San Francisco, CA 94124 (La Salle Apartments) is a 94 bathroom and 2.62 acre property. It was built in 1978 and has an estimate of $1,166,083.
- 35 Lillian Ct, San Francisco, CA 94124 (La Salle Apartments) is a 18 bathroom and 0.52 acre property. It was built in 1978 and has an estimate of $1,447,054.
- 1 Lillian Ct, San Francisco, CA 94124 (Shoreview) is a 0.81 acre property.