4239 Quigley Pl
Oakland, CA 94619
- 2Beds
- 1Bath
- 1,045ft²Living Area
- 4,256ft²Lot Size
- -Pool
- -Car
- 1923Year Built
- -DOM
- 1Permit
Property Valuations
Latest estimates for 4239 Quigley Pl based on TopHap automated valuation model (AVM).
TopHap Estimate
$680,832
$651/ft²
-$39K below Sold Price
Updated 3 months ago
Last Sold Price
$720,000
$689/ft²
10 months ago
4239 Quigley Pl is valued at $680,832 by TopHap AVM 3 months ago.
4239 Quigley Pl was last sold in 2023 for $720,000.
Permits
4239 Quigley Pl has 1 permit records.
Current Ownership
Information about the current owner(s).
Taxes Billed
Taxes billed in 2023$11,046.24From latest Total Assessed Value1.64%Total Assessed Value$674,000=Land+
Assessed Value$202,200Additions
Assessed Value$471,800
In 2023, taxes billed for 4239 Quigley Pl were $11,046.24, which is 1.64% from latest Total Assessed Value of $674,000.
Property History
4239 Quigley Pl has undefined property events records (listings, deeds, permits, tax, foreclosure, loan).
Environment
Environmental factors around 4239 Quigley Pl
Hazard Risks
Earthquake634Particulates101Nat'l Avg100Carb Mono100Ozone91Air Pollution87Lead39Tornado16Weather3Hail0Hurricane0Wind0
9 hazards (Carbon Monoxide, Earthquake Risk, Tornado Index, Air Pollution Index, Ozone Index, Weather Risk, Lead Index, Particulate Matter, National Average) are above the national average around 4239 Quigley Pl.
Walkability Index
14 /20
Most Walkable
20-18
Very Walkable
17-15
Somewhat Walkable
14-10
Car Dependent
9-0
4239 Quigley Pl has a walkability score of 14 out of 20, which means that it is in a somewhat walkable area.
Noise Level
57 dB
Quiet Suburban Residential 0-49
Suburban Residential 50-54
Urban Residential 55-59
Noisy Urban Residential 60-64
Very Noisy Urban Residential 65+
Noise at 4239 Quigley Pl is around 57dBs, which is comparable to a Urban Residential area.
Temperature
Seasonal temperature sampled over multiple years
Winter
Average
Low
41°F
High
57°F
Summer
Average
Low
53°F
High
74°F
In the winter at 4239 Quigley Pl, temperatures range from 40.98°F to 56.88°F with an average of 48.93°F. In the summer, the temperature ranges from 53.32°F to 74.3°F with and average of 63.81°F.
School Information
Public/private schools serving 4239 Quigley Pl
Public Schools
Nearby public schools serving 4239 Quigley Pl have ratings undefined, undefined, and undefined.
Neighborhood
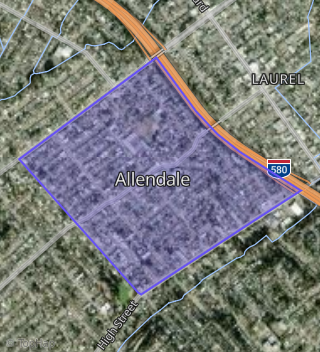
This property is located in Allendale, Oakland, CA 94619.
Seasonal Housing units 94619
7%of housing is for seasonal rent.
Daytime Population for 94619
-5%of people during work hours.
Boundary map of Allendale.
Crime Index for 94619
86
The crime index in 94619 is 86, which is 0.9 times lower than national average.
Market Trends
Historical market data near 4239 Quigley Pl over selected time period.
Nearby Properties on Quigley Pl
- 4239 Quigley Pl, Oakland, CA 94619 (Allendale) is a 1,045 square foot, 2 bedroom, 1 bathroom, 0.1 acre property. It was built in 1923 and has an estimate of $626,205 with a price per ft² of $599.
- 4245 Quigley Pl, Oakland, CA 94619 (Allendale) is a 943 square foot, 2 bedroom, 1 bathroom, 0.09 acre property. It was built in 1928 and has an estimate of $783,091 with a price per ft² of $830.
- 4251 Quigley Pl, Oakland, CA 94619 (Allendale) is a 1,897 square foot, 3 bedroom, 3.25 bathroom, 0.08 acre property. It was built in 1941 and has an estimate of $1,814,586 with a price per ft² of $957.