435 Lily St
Fairfield, CA 94533
- 4Beds
- 2Baths
- 1,474ft²Living Area
- 6,969ft²Lot Size
- -Pool
- 2Car
- 1969Year Built
- -DOM
- 1Permit
Property Valuations
Latest estimates for 435 Lily St based on TopHap automated valuation model (AVM).
TopHap Estimate
$444,100
$301/ft²
-$56K below Sold Price
Updated 3 months ago
Last Sold Price
$500,000
$339/ft²
22 months ago
435 Lily St is valued at $444,100 by TopHap AVM 3 months ago.
435 Lily St was last sold in 2022 for $500,000.
Permits
435 Lily St has 1 permit records.
Current Ownership
Information about the current owner(s).
Taxes Billed
Taxes billed in 2022$3,173.06From latest Total Assessed Value1.12%Total Assessed Value$284,057=Land+
Assessed Value$107,310Additions
Assessed Value$176,747
In 2022, taxes billed for 435 Lily St were $3,173.06, which is 1.12% from latest Total Assessed Value of $284,057.
Property History
435 Lily St has undefined property events records (listings, deeds, permits, tax, foreclosure, loan).
Environment
Environmental factors around 435 Lily St
Hazard Risks
Earthquake395Nat'l Avg100Particulates93Carb Mono87Air Pollution87Ozone83Lead42Hail2Hurricane0Tornado0Weather0Wind0
8 hazards (Carbon Monoxide, Earthquake Risk, Hail Index, Air Pollution Index, Ozone Index, Lead Index, Particulate Matter, National Average) are above the national average around 435 Lily St.
Walkability Index
12 /20
Most Walkable
20-18
Very Walkable
17-15
Somewhat Walkable
14-10
Car Dependent
9-0
435 Lily St has a walkability score of 12 out of 20, which means that it is in a somewhat walkable area.
Noise Level
46 dB
Quiet Suburban Residential 0-49
Suburban Residential 50-54
Urban Residential 55-59
Noisy Urban Residential 60-64
Very Noisy Urban Residential 65+
Noise at 435 Lily St is around 46dBs, which is comparable to a Quiet Suburban Residential area.
Temperature
Seasonal temperature sampled over multiple years
Winter
Average
Low
39°F
High
57°F
Summer
Average
Low
56°F
High
86°F
In the winter at 435 Lily St, temperatures range from 38.68°F to 56.92°F with an average of 47.8°F. In the summer, the temperature ranges from 55.54°F to 85.68°F with and average of 70.61°F.
School Information
Public/private schools serving 435 Lily St
Public Schools
Nearby public schools serving 435 Lily St have ratings undefined, undefined, undefined, and undefined.
Neighborhood
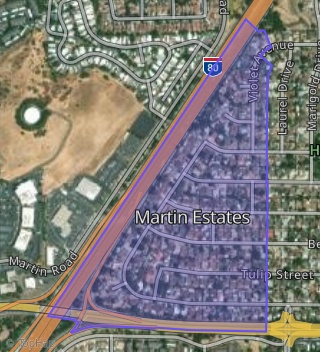
This property is located in Martin Estates, Fairfield, CA 94533.
Seasonal Housing units 94533
16%of housing is for seasonal rent.
Daytime Population for 94533
-7%of people during work hours.
Boundary map of Martin Estates.
Crime Index for 94533
103
The crime index in 94533 is 103, which is 1.0 times higher than national average.
Market Trends
Historical market data near 435 Lily St over selected time period.
Nearby Properties on Lily St
- 398 Lily St, Fairfield, CA 94533 (Martin Estates) is a 1,768 square foot, 4 bedroom, 2 bathroom, 0.18 acre property. It was built in 1969 and has an estimate of $561,620 with a price per ft² of $318.
- 393 Lily St, Fairfield, CA 94533 (Martin Estates) is a 1,213 square foot, 3 bedroom, 2 bathroom, 0.14 acre property. It was built in 1967 and has an estimate of $476,636 with a price per ft² of $393.
- 411 Lily St, Fairfield, CA 94533 (Martin Estates) is a 1,213 square foot, 3 bedroom, 2 bathroom, 0.14 acre property. It was built in 1967 and has an estimate of $477,534 with a price per ft² of $394.
- 326 Lily St, Fairfield, CA 94533 (Travis Acres) is a 1,438 square foot, 3 bedroom, 2 bathroom, 0.16 acre property. It was built in 1964 and has an estimate of $516,773 with a price per ft² of $359.
- 435 Lily St, Fairfield, CA 94533 (Martin Estates) is a 1,474 square foot, 4 bedroom, 2 bathroom, 0.16 acre property. It was built in 1969 and has an estimate of $493,485 with a price per ft² of $335.
- 434 Lily St, Fairfield, CA 94533 (Martin Estates) is a 1,337 square foot, 3 bedroom, 2 bathroom, 0.16 acre property. It was built in 1967 and has an estimate of $494,222 with a price per ft² of $370.
- 308 Lily St, Fairfield, CA 94533 (Travis Acres) is a 1,221 square foot, 3 bedroom, 2 bathroom, 0.14 acre property. It was built in 1966 and has an estimate of $496,422 with a price per ft² of $407.
- 314 Lily St, Fairfield, CA 94533 (Travis Acres) is a 1,583 square foot, 4 bedroom, 2 bathroom, 0.16 acre property. It was built in 1964 and has an estimate of $550,033 with a price per ft² of $347.
- 363 Lily St, Fairfield, CA 94533 (Travis Acres) is a 1,739 square foot, 3 bedroom, 2 bathroom, 0.14 acre property. It was built in 1971 and has an estimate of $486,434 with a price per ft² of $280.
- 332 Lily St, Fairfield, CA 94533 (Travis Acres) is a 1,516 square foot, 3 bedroom, 2 bathroom, 0.14 acre property. It was built in 1964 and has an estimate of $511,346 with a price per ft² of $337.
- 320 Lily St, Fairfield, CA 94533 (Travis Acres) is a 1,292 square foot, 3 bedroom, 2 bathroom, 0.21 acre property. It was built in 1964 and has an estimate of $517,146 with a price per ft² of $400.
- 387 Lily St, Fairfield, CA 94533 (Martin Estates) is a 1,337 square foot, 3 bedroom, 2 bathroom, 0.14 acre property. It was built in 1967 and has an estimate of $480,730 with a price per ft² of $360.
- 399 Lily St, Fairfield, CA 94533 (Martin Estates) is a 1,337 square foot, 3 bedroom, 2 bathroom, 0.14 acre property. It was built in 1967 and has an estimate of $481,594 with a price per ft² of $360.
- 381 Lily St, Fairfield, CA 94533 (Martin Estates) is a 1,474 square foot, 4 bedroom, 2 bathroom, 0.16 acre property. It was built in 1969 and has an estimate of $471,012 with a price per ft² of $320.
- 375 Lily St, Fairfield, CA 94533 (Travis Acres) is a 1,391 square foot, 3 bedroom, 2 bathroom, 0.15 acre property. It was built in 1966 and has an estimate of $499,735 with a price per ft² of $359.
- 374 Lily St, Fairfield, CA 94533 (Travis Acres) is a 1,391 square foot, 3 bedroom, 2 bathroom, 0.15 acre property. It was built in 1966 and has an estimate of $494,678 with a price per ft² of $356.
- 446 Lily St, Fairfield, CA 94533 (Martin Estates) is a 1,334 square foot, 3 bedroom, 2 bathroom, 0.2 acre property. It was built in 1967 and has an estimate of $512,194 with a price per ft² of $384.
- 440 Lily St, Fairfield, CA 94533 (Martin Estates) is a 1,474 square foot, 4 bedroom, 2 bathroom, 0.15 acre property. It was built in 1969 and has an estimate of $508,480 with a price per ft² of $345.
- 357 Lily St, Fairfield, CA 94533 (Travis Acres) is a 1,438 square foot, 4 bedroom, 2 bathroom, 0.14 acre property. It was built in 1965 and has an estimate of $488,402 with a price per ft² of $340.
- 369 Lily St, Fairfield, CA 94533 (Travis Acres) is a 1,438 square foot, 3 bedroom, 2 bathroom, 0.14 acre property. It was built in 1965 and has an estimate of $480,004 with a price per ft² of $334.
- 351 Lily St, Fairfield, CA 94533 (Travis Acres) is a 1,391 square foot, 3 bedroom, 2 bathroom, 0.14 acre property. It was built in 1966 and has an estimate of $467,606 with a price per ft² of $336.
- 362 Lily St, Fairfield, CA 94533 (Travis Acres) is a 1,391 square foot, 3 bedroom, 2 bathroom, 0.14 acre property. It was built in 1966 and has an estimate of $472,852 with a price per ft² of $340.
- 368 Lily St, Fairfield, CA 94533 (Travis Acres) is a 1,403 square foot, 3 bedroom, 2 bathroom, 0.16 acre property. It was built in 1971 and has an estimate of $505,131 with a price per ft² of $360.
- 356 Lily St, Fairfield, CA 94533 (Travis Acres) is a 1,438 square foot, 3 bedroom, 2 bathroom, 0.16 acre property. It was built in 1966 and has an estimate of $521,367 with a price per ft² of $363.
- 345 Lily St, Fairfield, CA 94533 (Travis Acres) is a 1,438 square foot, 4 bedroom, 2 bathroom, 0.14 acre property. It was built in 1965 and has an estimate of $489,583 with a price per ft² of $340.
- View more properties on Lily St