48 Lynch St
San Francisco, CA 94109
- -Bed
- 1Bath
- 880ft²Living Area
- 1,210ft²Lot Size
- -Pool
- -Car
- 1915Year Built
- -DOM
- -Permit
Property Valuations
Latest estimates for 48 Lynch St based on TopHap automated valuation model (AVM).
TopHap Estimate
$1,059,000
$1,203/ft²
Updated 11 months ago
48 Lynch St is valued at $1,059,000 by TopHap AVM 11 months ago.
Current Ownership
Information about the current owner(s).
Taxes Billed
Taxes billed in 2023$2,121.20From latest Total Assessed Value1.74%Total Assessed Value$122,079=Land+
Assessed Value$53,265Additions
Assessed Value$68,814
In 2023, taxes billed for 48 Lynch St were $2,121.2, which is 1.74% from latest Total Assessed Value of $122,079.
Property History
48 Lynch St has undefined property events records (listings, deeds, permits, tax, foreclosure, loan).
Environment
Environmental factors around 48 Lynch St
Hazard Risks
Earthquake372Particulates102Nat'l Avg100Carb Mono100Ozone91Air Pollution88Lead39Weather2Hail0Hurricane0Tornado0Wind0
8 hazards (Carbon Monoxide, Earthquake Risk, Air Pollution Index, Ozone Index, Weather Risk, Lead Index, Particulate Matter, National Average) are above the national average around 48 Lynch St.
Walkability Index
18 /20
Most Walkable
20-18
Very Walkable
17-15
Somewhat Walkable
14-10
Car Dependent
9-0
48 Lynch St has a walkability score of 18 out of 20, which means that it is in a most walkable area.
Noise Level
46 dB
Quiet Suburban Residential 0-49
Suburban Residential 50-54
Urban Residential 55-59
Noisy Urban Residential 60-64
Very Noisy Urban Residential 65+
Noise at 48 Lynch St is around 46dBs, which is comparable to a Quiet Suburban Residential area.
Temperature
Seasonal temperature sampled over multiple years
Winter
Average
Low
44°F
High
58°F
Summer
Average
Low
54°F
High
68°F
In the winter at 48 Lynch St, temperatures range from 43.76°F to 57.89°F with an average of 50.83°F. In the summer, the temperature ranges from 53.57°F to 67.65°F with and average of 60.61°F.
School Information
Public/private schools serving 48 Lynch St
Public Schools
Nearby public schools serving 48 Lynch St have ratings undefined, undefined, undefined, undefined, undefined, undefined, undefined, undefined, undefined, undefined, undefined, undefined, undefined, undefined, undefined, and undefined.
Neighborhood
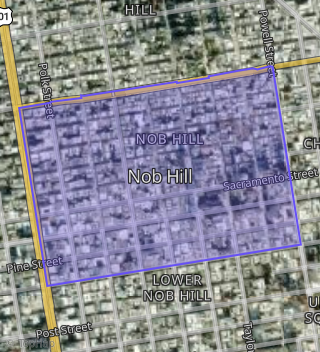
This property is located in Nob Hill, San Francisco, CA 94109.
Seasonal Housing units 94109
23%of housing is for seasonal rent.
Daytime Population for 94109
+4%of people during work hours.
Boundary map of Nob Hill.
Crime Index for 94109
155
The crime index in 94109 is 155, which is 1.6 times higher than national average.
Market Trends
Historical market data near 48 Lynch St over selected time period.
Nearby Properties on Lynch St
- 72 Lynch St, San Francisco, CA 94109 (Nob Hill) is a 1,030 square foot, 2 bedroom, 1.5 bathroom, 0.04 acre property. It was built in 1906 and has an estimate of $1,141,375 with a price per ft² of $1,108.
- 50 Lynch St, San Francisco, CA 94109 (Nob Hill) is a 1,637 square foot, 2 bedroom, 2 bathroom, 0.03 acre property. It was built in 1926 and has an estimate of $1,563,968 with a price per ft² of $892.
- 44 Lynch St, San Francisco, CA 94109 (Nob Hill) is a 1,044 square foot, 1 bathroom, 0.03 acre property. It was built in 1928 and has an estimate of $1,131,454 with a price per ft² of $1,084.
- 38 Lynch St, San Francisco, CA 94109 (Nob Hill) is a 1,179 square foot, 1 bathroom, 0.04 acre property. It was built in 1928 and has an estimate of $1,034,131 with a price per ft² of $877.
- 46 Lynch St, San Francisco, CA 94109 (Nob Hill) is a 1,744 square foot, 3 bathroom, 0.03 acre property. It was built in 1911 and has an estimate of $1,459,752 with a price per ft² of $837.
- 48 Lynch St, San Francisco, CA 94109 (Nob Hill) is a 880 square foot, 1 bathroom, 0.03 acre property. It was built in 1915 and has an estimate of $912,626 with a price per ft² of $1,037.
- 62 Lynch St, San Francisco, CA 94109 (Nob Hill) is a 980 square foot, 2 bedroom, 1 bathroom, 0.03 acre property. It was built in 1900 and has an estimate of $1,024,005 with a price per ft² of $1,045.
- 68 Lynch St, San Francisco, CA 94109 (Nob Hill) is a 2,132 square foot, 2 bathroom, 0.03 acre property. It was built in 1900 and has an estimate of $1,491,852 with a price per ft² of $700.
- 74 Lynch St, San Francisco, CA 94109 (Nob Hill) is a 970 square foot, 2 bedroom, 1 bathroom, 0.04 acre property. It was built in 1906 and has an estimate of $987,670 with a price per ft² of $950.