653 Morva Ct
Hayward, CA 94541
- 2Beds
- 1Bath
- 1,063ft²Living Area
- 4,040ft²Lot Size
- -Pool
- -Car
- 1947Year Built
- -DOM
- 4Permits
Property Valuations
Latest estimates for 653 Morva Ct based on TopHap automated valuation model (AVM).
TopHap Estimate
$995,400
$936/ft²
+$270K above Sold Price
Updated 3 months ago
Last Sold Price
$725,000
$682/ft²
2 years ago
653 Morva Ct is valued at $995,400 by TopHap AVM 3 months ago.
653 Morva Ct was last sold in 2021 for $725,000.
Permits
653 Morva Ct has 4 permit records.
Current Ownership
Information about the current owner(s).
Taxes Billed
Taxes billed in 2023$10,607.94From latest Total Assessed Value1.43%Total Assessed Value$739,500=Land+
Assessed Value$221,850Additions
Assessed Value$517,650
In 2023, taxes billed for 653 Morva Ct were $10,607.94, which is 1.43% from latest Total Assessed Value of $739,500.
Property History
653 Morva Ct has undefined property events records (listings, deeds, permits, tax, foreclosure, loan).
Environment
Environmental factors around 653 Morva Ct
Hazard Risks
Earthquake599Particulates106Nat'l Avg100Carb Mono100Ozone87Air Pollution86Lead40Tornado10Wind3Weather1Hail0Hurricane0
10 hazards (Carbon Monoxide, Earthquake Risk, Tornado Index, Air Pollution Index, Ozone Index, Wind Index, Weather Risk, Lead Index, Particulate Matter, National Average) are above the national average around 653 Morva Ct.
Walkability Index
12 /20
Most Walkable
20-18
Very Walkable
17-15
Somewhat Walkable
14-10
Car Dependent
9-0
653 Morva Ct has a walkability score of 12 out of 20, which means that it is in a somewhat walkable area.
Noise Level
37 dB
Quiet Suburban Residential 0-49
Suburban Residential 50-54
Urban Residential 55-59
Noisy Urban Residential 60-64
Very Noisy Urban Residential 65+
Noise at 653 Morva Ct is around 37dBs, which is comparable to a Quiet Suburban Residential area.
Temperature
Seasonal temperature sampled over multiple years
Winter
Average
Low
42°F
High
58°F
Summer
Average
Low
54°F
High
75°F
In the winter at 653 Morva Ct, temperatures range from 41.5°F to 57.85°F with an average of 49.68°F. In the summer, the temperature ranges from 54.38°F to 75.39°F with and average of 64.89°F.
School Information
Public/private schools serving 653 Morva Ct
Public Schools
Nearby public schools serving 653 Morva Ct have ratings undefined, undefined, and undefined.
Neighborhood
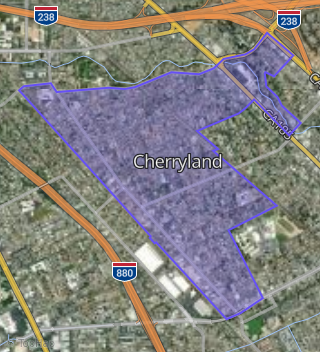
This property is located in Cherryland, Hayward, CA 94541.
Seasonal Housing units 94541
12%of housing is for seasonal rent.
Daytime Population for 94541
-20%of people during work hours.
Boundary map of Cherryland.
Crime Index for 94541
107
The crime index in 94541 is 107, which is 1.1 times higher than national average.
Market Trends
Historical market data near 653 Morva Ct over selected time period.
Nearby Properties on Morva Ct
- 659 Morva Ct, Hayward, CA 94541 (Cherryland) is a 1,249 square foot, 2 bedroom, 1 bathroom, 0.13 acre property. It was built in 1947 and has an estimate of $660,112 with a price per ft² of $529.
- 653 Morva Ct, Hayward, CA 94541 (Cherryland) is a 1,063 square foot, 2 bedroom, 1 bathroom, 0.09 acre property. It was built in 1947 and has an estimate of $728,016 with a price per ft² of $685.
- 688 Morva Ct, Hayward, CA 94541 (Cherryland) is a 1,248 square foot, 2 bedroom, 2 bathroom, 0.1 acre property. It was built in 1948 and has an estimate of $650,199 with a price per ft² of $521.
- 686 Morva Ct, Hayward, CA 94541 (Cherryland) is a 1,396 square foot, 4 bedroom, 2 bathroom, 0.1 acre property. It was built in 1948 and has an estimate of $759,499 with a price per ft² of $544.
- 681 Morva Ct, Hayward, CA 94541 (Cherryland) is a 1,248 square foot, 2 bedroom, 2 bathroom, 0.09 acre property. It was built in 1948 and has an estimate of $669,487 with a price per ft² of $536.
- 665 Morva Ct, Hayward, CA 94541 (Cherryland) is a 2,400 square foot, 4 bedroom, 4 bathroom, 0.2 acre property. It was built in 1950 and has an estimate of $1,056,367 with a price per ft² of $440.
- 677 Morva Ct, Hayward, CA 94541 (Cherryland) is a 1,248 square foot, 2 bedroom, 2 bathroom, 0.09 acre property. It was built in 1948 and has an estimate of $676,371 with a price per ft² of $542.