933 Tarragon Ct
Lompoc, CA 93436
- 3Beds
- 2Baths
- 1,558ft²Living Area
- 7,405ft²Lot Size
- -Pool
- -Car
- 1990Year Built
- -DOM
- -Permit
Property Valuations
Latest estimates for 933 Tarragon Ct based on TopHap automated valuation model (AVM).
TopHap Estimate
$570,000
$365/ft²
+$115K above Sold Price
Updated 3 months ago
Last Sold Price
$455,000
$292/ft²
3 years ago
933 Tarragon Ct is valued at $570,000 by TopHap AVM 3 months ago.
933 Tarragon Ct was last sold in 2020 for $455,000.
Current Ownership
Information about the current owner(s).
Taxes Billed
Taxes billed in 2023$5,257.88From latest Total Assessed Value1.11%Total Assessed Value$473,382=Land+
Assessed Value$119,646Additions
Assessed Value$353,736
In 2023, taxes billed for 933 Tarragon Ct were $5,257.88, which is 1.11% from latest Total Assessed Value of $473,382.
Property History
933 Tarragon Ct has undefined property events records (listings, deeds, permits, tax, foreclosure, loan).
Environment
Environmental factors around 933 Tarragon Ct
Hazard Risks
Earthquake254Nat'l Avg100Particulates100Lead94Ozone89Air Pollution89Carb Mono65Tornado1Weather1Hail0Hurricane0Wind0
9 hazards (Carbon Monoxide, Earthquake Risk, Tornado Index, Air Pollution Index, Ozone Index, Weather Risk, Lead Index, Particulate Matter, National Average) are above the national average around 933 Tarragon Ct.
Walkability Index
8 /20
Most Walkable
20-18
Very Walkable
17-15
Somewhat Walkable
14-10
Car Dependent
9-0
933 Tarragon Ct has a walkability score of 8 out of 20, which means that it is in a car dependent area.
Noise Level
47 dB
Quiet Suburban Residential 0-49
Suburban Residential 50-54
Urban Residential 55-59
Noisy Urban Residential 60-64
Very Noisy Urban Residential 65+
Noise at 933 Tarragon Ct is around 47dBs, which is comparable to a Quiet Suburban Residential area.
Temperature
Seasonal temperature sampled over multiple years
Winter
Average
Low
41°F
High
64°F
Summer
Average
Low
52°F
High
75°F
In the winter at 933 Tarragon Ct, temperatures range from 41.29°F to 63.64°F with an average of 52.47°F. In the summer, the temperature ranges from 52.31°F to 75.24°F with and average of 63.78°F.
School Information
Public/private schools serving 933 Tarragon Ct
Public Schools
Nearby public schools serving 933 Tarragon Ct have ratings undefined, undefined, and undefined.
Neighborhood
This property is located in 93436.
Seasonal Housing units 93436
15%of housing is for seasonal rent.
Daytime Population for 93436
-23%of people during work hours.
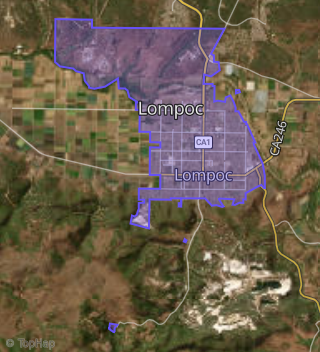
Boundary map of 93436.
Crime Index for 93436
94
The crime index in 93436 is 94, which is 0.9 times lower than national average.
Market Trends
Historical market data near 933 Tarragon Ct over selected time period.
Nearby Properties on Tarragon Ct
- 933 Tarragon Ct, Lompoc, CA 93436 is a 1,558 square foot, 3 bedroom, 2 bathroom, 0.17 acre property. It was built in 1990 and has an estimate of $540,975 with a price per ft² of $347.
- 932 Tarragon Ct, Lompoc, CA 93436 is a 1,436 square foot, 3 bedroom, 2 bathroom, 0.17 acre property. It was built in 1990 and has an estimate of $528,750 with a price per ft² of $368.
- 924 Tarragon Ct, Lompoc, CA 93436 is a 1,740 square foot, 3 bedroom, 3.25 bathroom, 0.22 acre property. It was built in 1990 and has an estimate of $586,975 with a price per ft² of $337.
- 901 Tarragon Ct, Lompoc, CA 93436 is a 1,558 square foot, 3 bedroom, 2 bathroom, 0.2 acre property. It was built in 1990 and has an estimate of $527,300 with a price per ft² of $338.
- 905 Tarragon Ct, Lompoc, CA 93436 is a 1,558 square foot, 3 bedroom, 2 bathroom, 0.25 acre property. It was built in 1990 and has an estimate of $544,076 with a price per ft² of $349.
- 925 Tarragon Ct, Lompoc, CA 93436 is a 1,436 square foot, 3 bedroom, 2 bathroom, 0.16 acre property. It was built in 1990 and has an estimate of $535,075 with a price per ft² of $373.
- 928 Tarragon Ct, Lompoc, CA 93436 is a 1,558 square foot, 3 bedroom, 3.25 bathroom, 0.16 acre property. It was built in 1990 and has an estimate of $543,053 with a price per ft² of $349.
- 909 Tarragon Ct, Lompoc, CA 93436 is a 1,740 square foot, 4 bedroom, 3.25 bathroom, 0.16 acre property. It was built in 1990 and has an estimate of $571,727 with a price per ft² of $329.
- 900 Tarragon Ct, Lompoc, CA 93436 is a 1,658 square foot, 3 bedroom, 2 bathroom, 0.23 acre property. It was built in 1990 and has an estimate of $550,387 with a price per ft² of $332.
- 921 Tarragon Ct, Lompoc, CA 93436 is a 1,658 square foot, 3 bedroom, 2 bathroom, 0.16 acre property. It was built in 1990 and has an estimate of $554,920 with a price per ft² of $335.
- 929 Tarragon Ct, Lompoc, CA 93436 is a 1,436 square foot, 3 bedroom, 2 bathroom, 0.16 acre property. It was built in 1990 and has an estimate of $527,764 with a price per ft² of $368.
- 913 Tarragon Ct, Lompoc, CA 93436 is a 1,658 square foot, 3 bedroom, 2 bathroom, 0.21 acre property. It was built in 1990 and has an estimate of $539,936 with a price per ft² of $326.
- 917 Tarragon Ct, Lompoc, CA 93436 is a 1,740 square foot, 3 bedroom, 3.25 bathroom, 0.25 acre property. It was built in 1990 and has an estimate of $585,301 with a price per ft² of $336.